

Introduction
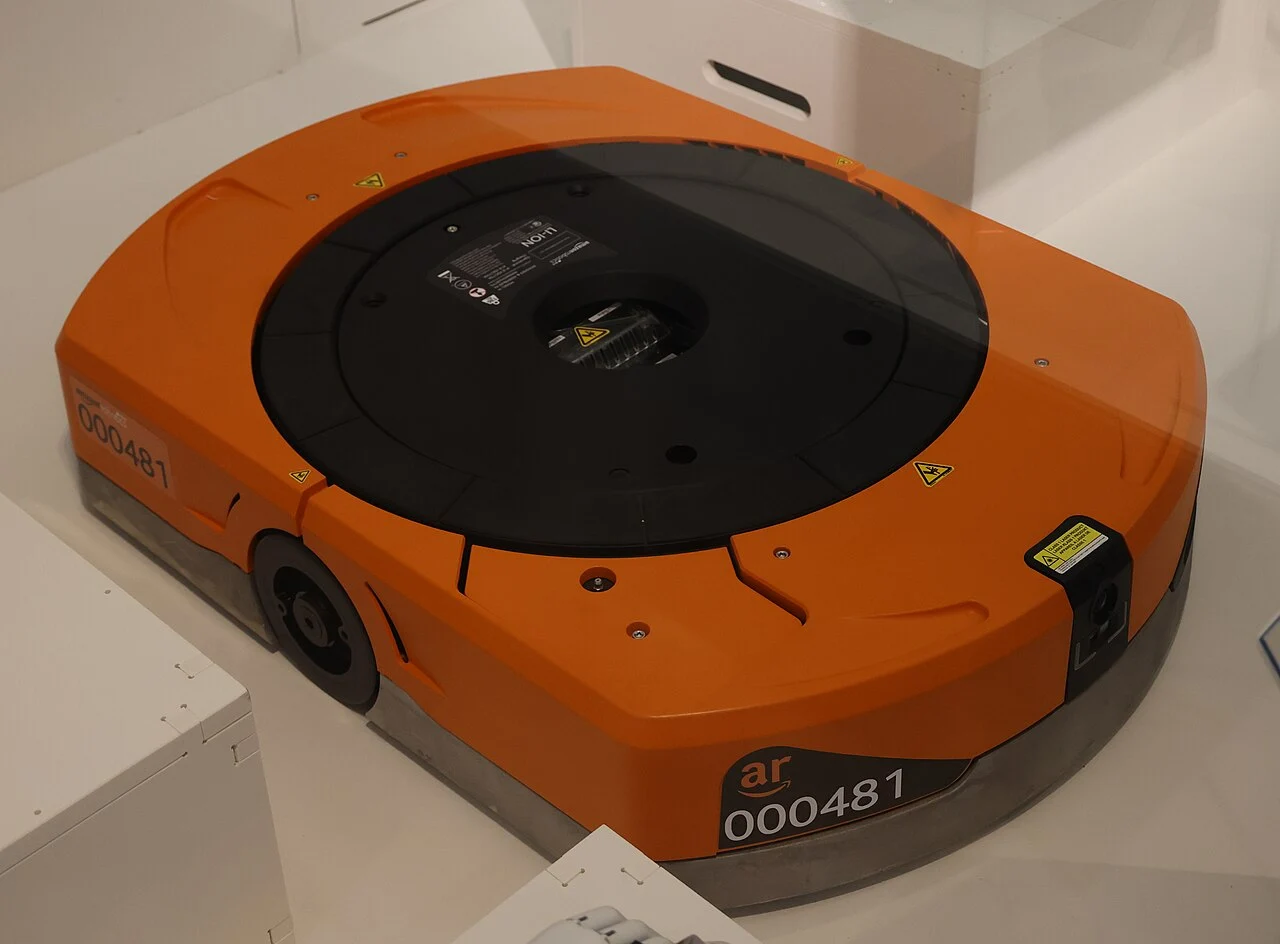
Warehouse automation cost depends on the flow being automated, not the number of robots in a sales slide. A fleet needs mobile robots, charging, fleet software, wireless coverage, WMS or WES integration, stations, scanners, safety work, training and support. Conveyors, lifts or robotic arms may add fixed infrastructure. The same 20 AMRs can deliver different output depending on travel distance, congestion, order profile and operator availability.
This guide builds a transparent ROI model rather than presenting supplier estimates as universal prices. The scenarios are illustrative and dated July 15, 2026. They are not offers from an AMR manufacturer or integrator. Replace each assumption with site data and written quotes. The model tracks cost per movement, cost per order, utilization, downtime and payback while exposing the variables that can make a pilot look better than full production.
Key findings
- Robot hardware is only one part of the budget; integration, stations, networking and support can be equally important.
- Fleet utilization is constrained by charging, congestion, waiting at stations, maintenance and unavailable upstream work.
- ROI should compare the same throughput and service level, including labor retained for exceptions and replenishment.
- A successful pilot on one aisle does not prove full-site performance because traffic interactions grow nonlinearly.
- Illustrative numbers must remain labeled assumptions until replaced by a vendor quote or measured site value.
Illustrative warehouse automation scenarios
Simple payback = capital allowance ÷ (annual measurable benefit − annual operating cost). All rows are article-created scenarios, not supplier prices.
| Scenario | Capital allowance | Annual operating cost | Annual measurable benefit | Simple payback |
|---|---|---|---|---|
| 10 AMRs for point-to-point transport | US$600,000 | US$120,000 | US$310,000 | 3.2 years |
| 25 AMRs with WMS integration and workstations | US$1,650,000 | US$290,000 | US$760,000 | 3.5 years |
| Conveyor plus robotic palletizing expansion | US$2,400,000 | US$360,000 | US$1,080,000 | 3.3 years |
| Goods-to-person system with storage automation | US$8,500,000 | US$1,150,000 | US$3,250,000 | 4.0 years |
Financing, tax, depreciation, building work and residual value are excluded.
Map the current flow before selecting technology
Start with a time-and-motion study. Count movements by origin, destination, load type, distance and hour. Separate productive travel from searching, waiting and exception handling. Record order lines, pallets, totes, replenishment and returns. A robot project that automates an unstable process can move waste faster without improving customer service. Baseline data must use the same peak period that the future system is expected to support.
Define the service target orders per hour, cut-off time, dock-to-stock time or labor exposure. Then identify constraints such as narrow aisles, elevators, cold rooms, fire doors and mixed pedestrian traffic. The automation concept should solve the dominant bottleneck. AMRs are effective for variable routes and staged transport; conveyors are effective for steady high-volume lanes; storage systems are effective when space and retrieval density dominate.
AMR hardware and fleet software
An AMR price depends on payload, top module, safety sensors, battery, environmental rating and order volume. The vehicle usually arrives with fleet-management software that assigns tasks, manages traffic and routes robots to chargers. Licensing can be perpetual, subscription-based or bundled with support. Ask whether the quote includes simulation, analytics, maps, software updates and interfaces for future fleet expansion.
Fleet software must coordinate more than shortest paths. It resolves intersections, queueing, one-way aisles, priority tasks and blocked routes. Poor traffic rules can make added robots reduce throughput. A buyer should request a simulated saturation curve showing output as fleet size grows. Confirm whether multiple robot types or brands can share the environment or whether the site becomes locked to one fleet manager.
WMS, WES and business integration
The warehouse management system owns inventory and orders. A warehouse execution system may sequence work across automation. The robot fleet executes transport tasks. Integration defines how an order becomes a mission, how completion is acknowledged and what happens after a short pick, missing tote or blocked destination. API availability is only the beginning; data ownership and recovery behavior determine production reliability.
Budget interface development, test environments, cybersecurity review and support across software upgrades. A hard-coded connector can fail after a WMS release. Message queues and idempotent transactions help prevent duplicated missions. Operators need visibility when one layer says a tote moved and another disagrees. Acceptance tests should include network loss, duplicate messages, inventory exceptions and manual fallback.
Wi-Fi, positioning and site infrastructure
AMRs localize primarily from onboard sensors, but reliable wireless connectivity is still required for missions, fleet coordination, updates and diagnostics. Consumer coverage maps are insufficient. Survey signal strength, roaming, channel utilization and latency at robot height with doors, racks and inventory in place. Metal shelving and moving loads can alter radio behavior. Separate robot networks and quality-of-service policies may be needed.
Infrastructure includes charging locations, floor repair, lane markings where used, protective barriers, doors and elevators. Automatic doors need safe interfaces and state confirmation. Floor joints, ramps and drainage can exceed robot limits. Charging stations consume space and electrical capacity. A design that leaves no maintenance parking or recovery route creates operational problems after the first disabled robot.
Workstations, scanners and human work
Automation moves work to people as often as it replaces travel. Goods-to-person stations need ergonomic height, displays, scanners, confirmation buttons and space for empty containers. The station cycle determines system throughput. If an operator waits for product, robot dispatch may be weak. If robots queue behind a slow operator, adding vehicles will not solve the bottleneck.
Include replenishment, tote induction, damaged goods and quality checks. Robots do not eliminate exception work. A realistic labor model keeps people for supervision, maintenance, inventory correction and peak recovery. Measure walking and lifting reduction as well as headcount. Better ergonomics and predictable workload can be valuable even when direct labor savings alone do not justify the project.
Charging, battery and availability
Robot availability is lower than scheduled hours. Time is lost to charging, preventive maintenance, faults, blocked paths and waiting for work. Opportunity charging can keep a fleet active during natural pauses, while battery swapping changes labor and equipment needs. Published runtime figures must be replaced by measurements using the actual payload, speed, floor and traffic.
Calculate utilization from productive loaded or assigned time, not powered-on time. A robot that waits at a station for 20 minutes is available but not adding throughput. Fleet dashboards should separate travel, queueing, charging, fault and idle states. That data reveals whether the next investment should be another robot, a faster station or a process change.
Safety and mixed traffic
AMRs use safety-rated sensors and control functions, but the deployed system still requires risk assessment. Loads can block sensor fields. Forklifts move faster and have long stopping distances. Blind intersections and docks create conflicts. Top modules such as conveyors or lifts add pinch and shear hazards. Safety speed and protective fields affect throughput, so the operational and safety models must use the same assumptions.
Pedestrian rules, floor markings, mirrors and traffic separation can reduce interaction. Emergency stops need accessible placement and restart procedures. A robot should stop safely after localization or communication faults, but stopping in a fire door or narrow aisle can block the operation. Recovery routes and authorized manual movement must be defined before deployment.
Building the capital budget
Create separate lines for robots, top modules, chargers, fleet licenses, integration, WMS/WES work, Wi-Fi, workstations, scanners, safety equipment, conveyors, electrical work, floor changes, training, spares and project management. Include a contingency only for named unresolved risks. Do not hide undefined interfaces inside a large percentage without explaining what could trigger it.
Vendor quotes should state taxes, freight, installation, warranty and software renewal. Confirm whether batteries are included and how many chargers support the promised throughput. A pilot price may exclude production hardening. Full deployment often needs higher availability, redundant servers, spare vehicles and support coverage outside office hours.
Cost per movement and cost per order
Cost per movement divides annualized system cost by completed transport missions. Annualized cost can include depreciation or lease payments, software, support, maintenance, energy and retained labor. The denominator must count successful useful moves, not dispatched missions that were canceled or duplicated. Cost per order allocates transport and station cost across shipped orders and can reveal whether small orders consume disproportionate resources.
Compare with the baseline using the same volume and service target. If automation increases capacity, include the contribution from additional orders only when demand exists. Avoid valuing theoretical capacity that the business cannot sell. Sensitivity analysis should vary volume, labor rate, availability and utilization rather than publishing one exact payback.
Illustrative ROI calculation
Consider the 25-AMR scenario in the table. Capital allowance is US$1.65 million. Annual measurable benefit is assumed at US$760,000 from reduced travel labor, avoided overtime and added throughput. Annual operating cost is US$290,000 for support, software, maintenance, energy and retained technical labor. Net annual benefit is US$470,000, producing a simple payback of about 3.5 years.
That answer is only as credible as the assumptions. If utilization falls or WMS integration delays deployment, payback lengthens. If the system prevents a second shift expansion and demand supports the output, benefit rises. A board-ready model should show low, base and high cases and identify which values come from measurements, contracts or management forecasts.
Pilot design and scale-up
A pilot should test the hardest representative flow, not a demonstration lane cleared of traffic. Include peak order mix, pedestrians, forklifts, blocked routes, battery cycles and real WMS messages. Define success thresholds for throughput, mission completion, intervention rate and station waiting. Record every manual recovery and classify the cause.
Scale-up needs a traffic model. Intersections and shared stations can saturate as fleet size grows. Map governance, software releases and operator training become recurring processes. Expansion should be staged with measured performance after each group of robots. A fleet that meets its target at ten vehicles may need layout changes before it reaches thirty.
Hidden costs and contract terms
Hidden costs include annual licenses, remote-support connectivity, replacement batteries, spare safety scanners, map changes, third-party API fees and travel for specialist technicians. Building landlords may need to approve floor or electrical work. Cybersecurity can require certificates, device management and segmented networks. Production may need temporary labor during cutover.
Contracts should define availability, support response, software support period, data access and exit options. Ask whether operational data can be exported if the supplier changes. Confirm who owns custom integrations. A low initial subscription can become expensive if the warehouse cannot operate without proprietary cloud services and renewal terms are unclear.
Limitations and missing information
- All scenario costs and benefits are illustrative assumptions, not official supplier prices or guaranteed savings.
- ROI depends on local wages, order profile, building constraints, utilization, support terms and demand.
- Simple payback ignores financing, tax, depreciation and time value of money.
- Pilot throughput may not scale linearly because traffic and station queues grow with fleet size.
- Software subscriptions, battery replacement and specialist support can materially change ownership cost.
Conclusion
Warehouse automation pays when a measured bottleneck, reliable integration and sustained utilization support the capital. Build the model from missions, stations and exceptions, then price every enabling layer around the robots. The illustrative scenarios show payback near three to four years only under their stated assumptions. Replace them with site data, test the hardest flow and treat manual recovery as a tracked production metric.
Frequently asked questions
How much does warehouse automation cost?
It ranges from a focused AMR pilot to a multi-million-dollar goods-to-person system. The total includes robots, software, integration, workstations, infrastructure, safety and support.
How is warehouse automation ROI calculated?
Compare net annual measurable benefit with capital cost. Simple payback divides capital by annual benefit minus annual operating cost, while a full model can use discounted cash flow.
What is a good AMR utilization rate?
There is no universal target. Measure productive mission time separately from charging, queueing, waiting and faults, then size the fleet for the required peak throughput.
Can more AMRs reduce throughput?
Yes. Congested intersections, shared stations and poor traffic rules can create queues. Simulation and staged expansion are necessary.
Does an AMR project eliminate warehouse labor?
Usually not. People remain for induction, exceptions, maintenance, inventory correction, supervision and processes that are not automated.
Sources and methodology
Evidence for warehouse automation cost was rechecked on July 23, 2026 against Association for Advancing Automation, International Federation of Robotics, MHI. Time-sensitive prices, permits, service areas and certifications stay dated, and a missing supplier value is not converted into an official specification.
Related TechniaHQRobot guides
Share this article
Share the current TechniaHQRobot article page.
Continue reading
Open the latest robotics reporting, Physical AI analysis and hardware notes.